|
|
|
|
| STEP 10 of 10 - Reports
& KPI's |
 |
|
 Previous
 |
|
There is a basic rule in any software application: all
information you introduce into the system can be sorted out and
generate results in the form of alerts, events, analysis and
correlations.
In InnWinWin, Analysis are divided into 2 categories:
Automatic Parameters – set of parameters the
system calculates automatically. Ex.: total maintenance costs,
corrective maintenance costs.
Manual Parameters – set of parameters the user
can introduce manually into the system. Ex. : useful floor area
of the building, number of occupied rooms in a hotel. A manual
parameter is basically information that is “outside” the
software which, by manually recording it into the software,
allows you to cross-analyze it with automatic parameters
creating your own key performance indicators (KPIs).
 With
InnWinWin you can create your own Analysis and Indicators.
Choose the parameters you want in your numerator and denominator
and specify to whom or to what does this indicator apply to
(selection criteria). When clicking <Compute> you will view
monthly evolution of these indicators for the selected year.
Once your indicator is created, it will be saved into the system
and you will be able to compute the same indicator for different
years, which is extremely useful for comparisons. With
InnWinWin you can create your own Analysis and Indicators.
Choose the parameters you want in your numerator and denominator
and specify to whom or to what does this indicator apply to
(selection criteria). When clicking <Compute> you will view
monthly evolution of these indicators for the selected year.
Once your indicator is created, it will be saved into the system
and you will be able to compute the same indicator for different
years, which is extremely useful for comparisons.
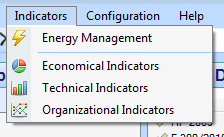
Indicators are organized in:
|
Energy Management |
 |
SCB (Specific
Consumption of the Building) – SCB is obtained by
dividing the annual consumption of energy of the
building (electricity, gas, fuel, etc.), converted into
the common unit Kgep or tep (kilograms equivalent to
petroleum or tonnes equivalent to petroleum), by the
Useful Floor Area, Au. Other energetic efficiency
indicators can also be computed using other reference
units, like, for example, in a hotel the occupied room,
in a restaurant the meal, in a commercial building the
visitor, etc..
Each meter (electrical, gas, water) must be recorded
into the system as a standard maintenance item and
frequent readings must be made and recorded in the
item’s Running Records. |
|
|
|
|
Economic Indicators (some examples): |
|
|
MC – Total
Maintenance Cost – all costs with maintenance tasks
performed |
|
|
IPC – Internal Personnel Cost – costs with all internal
personnel. This value is computed through the use of
standard man/hour rates. |
|
|
CMC – Corrective Maintenance Cost – costs with
corrective maintenance tasks |
|
|
|
|
Technical Indicators (some examples): |
|
|
RQT – Required Time
– time interval during which the user requires the item
to be in a condition to perform a required function |
|
|
DTRM – Down Time Related to Maintenance – time interval
during which as item is in a down state due to
maintenance. |
|
|
DTRF – Down Time Related to Faults – time interval
during which as item is in a down state due to failures |
|
|
|
|
organisational Indicators:
|
|
|
CMMH – Corrective
Maintenance Man-Hours – total man-hours spent on
corrective maintenance activities (internal and
external) |
|
|
PMMH – Down Time Related to Maintenance – total
man-hours spent on preventive maintenance activities
(internal and external) |
|
|
TMH – Total Maintenance Man-Hours – Number of man-hours
carried out by internal and external maintenance
personnel. It represents total human effort carried out
on maintenance activities. |
 Tips & best practices
 |
|
|
Using manual parameters enables you to
create indicators with data outside the
program. You may compute, for example,
the following indicator: Total
Maintenance Cost divided by Annual
Company Sales |
|
|
Automatic parameters are always updated
and you can check them anytime. Cost
Centers, Clients, Objects (Items),
Systems and the organisation itself are
the entities with automatic parameters.
To view these parameters, right-click on
any of these entities and select
<Analysis> |
|
|
|
|
| |
|
|
| |
|
|
Products |
|
|
| |
 Contact us
 |
|
|
| |
| |
| |
|